- Uncertainty surrounding the eventual economic impact of the coronavirus has driven market volatility higher.
- It’s useful to realize that volatility has been higher in the past and can still increase from here.
- It’s also helpful to understand that it is normal for market declines to occur at some point almost every year.
February of 2020 ended with a decline in the S&P 500 Index that quickly became a rout, pushing the index into correction territory. Economic uncertainties over the eventual impact of the coronavirus drove market volatility higher and punished the equity index with a vengeance.
While analysts debated whether this would be merely a short pause in the market’s upward trajectory or the beginning of an extended downturn, investors worried about losses in their portfolios as the index retreated from its previous all-time high.
However, the first trading day of March saw the S&P 500 Index have its second-largest percentage gain in over ten years, a reminder that upticks in volatility can swing the market in either direction.
Everything Old is New Again
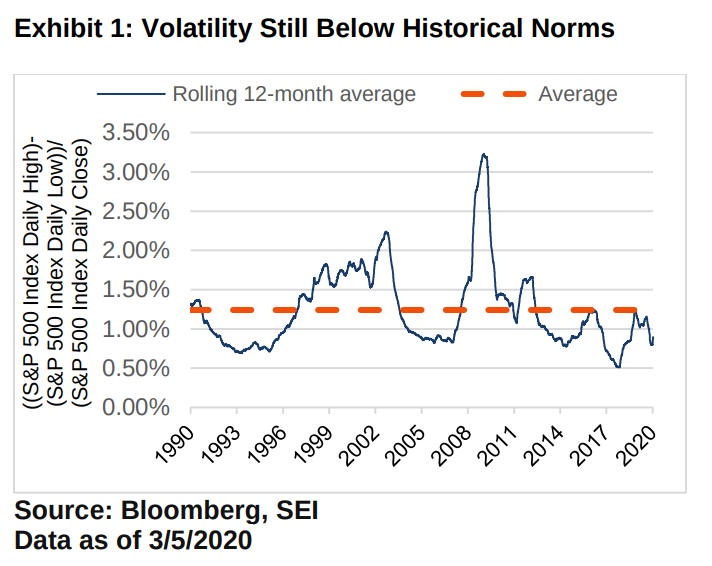
It’s important to realize that volatility has been higher in the past and could still increase from its current level. The popularity of the S&P 500 as a benchmark for U.S. equities makes it a useful point of reference for gauging stock-market volatility.
While there are countless ways to measure stock market volatility, one relatively simple method is to calculate the rolling 12-month average difference between the daily high and low of an index relative to the price of the index itself at close of the market. By this measure, over the past full-year, volatility in the U.S. stock market remains well below its 30-year average, despite the recent higher change in trend (Exhibit 1).
While most analysts have attributed the higher volatility to accelerating concerns over the spread of the coronavirus, U.S. equity markets have had a long run of below-average volatility over the past 11 years, a period that has seen the S&P 500 Index enjoy an extend upward trend since bottoming in early 2009.
While it’s human nature to feel discomforted by the acceleration in volatility, it’s also practical to keep in mind that volatility is normal. It’s an expected, if unpredictable, part of investing and is as dynamic as the market itself. Nobody can say with certainty where either the market or volatility will go from this point.
Markets Move Down, Too
Although investors hope to see their portfolios generate gains, market declines are inevitable and occur, at some point, almost every year. While some declines are more significant than others, even in years with notable declines that cause uneasiness for investors, the market can still generate positive returns.
In fact, while the S&P 500 Index has delivered an annualized return over 6% over the past 20 years—a period which includes both the collapse of the tech bubble in 2001-2002 and the great financial crisis in 2008—the average intra-year decline over this period has averaged more than 15%. (Exhibit 2).

Our View
While the coronavirus issue is the current focus of concerns, when it passes, another will eventually arise. Something always poses a potential threat to the stock market. For this reason, we believe that a diversified portfolio is one of the best ways to reduce risk and increase the odds that investors will remain focused and stick to their investment strategies in good times and bad.
Glossary: Drawdown refers to a peak-to-trough move down for an investment within a specific period of time, usually measured in percentage terms.
Index Definitions: The S&P 500 Index is an unmanaged, market-weighted index that consists of 500 of the largest publicly-traded U.S. companies and is considered representative of the broad U.S. stock market.
Important Information: This material represents an assessment of the market environment at a specific point in time and is not intended to be a forecast of future events, or a guarantee of future results. This information should not be relied upon by the reader as research or investment advice and is intended for educational purposes only. There are risks involved with investing, including loss of principal. Diversification may not protect against market risk. Information provided by SEI Investments Management Corporation (SIMC), a wholly owned subsidiary of SEI Investments Company (SEI). Index returns are for illustrative purposes only and do not represent actual investment performance. Index returns do not reflect any management fees, transaction costs or expenses. Indexes are unmanaged and one cannot invest directly in an index. Past performance does not guarantee future results.